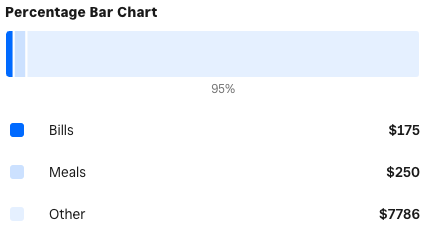
Percentage Bar Chart
A percentage chart is a type of graph used to represent data as parts of a whole, making it easier to understand the proportion of each category relative to the total.
Component render
<PercentageBarChart
  data={[
    {
      formattedValue: '$175',
      key: 'Bills',
      label: 'Bills',
      value: 175
    },
    {
      formattedValue: '$250',
      key: 'Meals',
      label: 'Meals',
      value: 250
    },
    {
      formattedValue: '$1K',
      key: 'Other',
      label: 'Other',
      value: 1020
    },
    {
      formattedValue: '$4.5K',
      key: 'Payroll',
      label: 'Payroll',
      value: 4466
    },
    {
      formattedValue: '$1.5K',
      key: 'Personal',
      label: 'Personal',
      value: 1500
    },
    {
      formattedValue: '$800',
      key: 'Rent',
      label: 'Rent',
      value: 800
    }
  ]}
  name="PercentageBarChart"
/>
Properties
| Property | Type | Description |
|---|---|---|
data | BarsDataItem[] | Required. The data to display in the chart. |
order | ascending | descending | none | The sort order of the data to display in the chart. |
name | string | Accessible name for the chart. See: https://www.w3schools.com/tags/att_name.asp |
enableLegend | boolean | Defaults to false. Will auto-generate a legend for you below the chart. |